Why Cathodic Protection Is Difficult to Monitor from Standard ROV Surveys
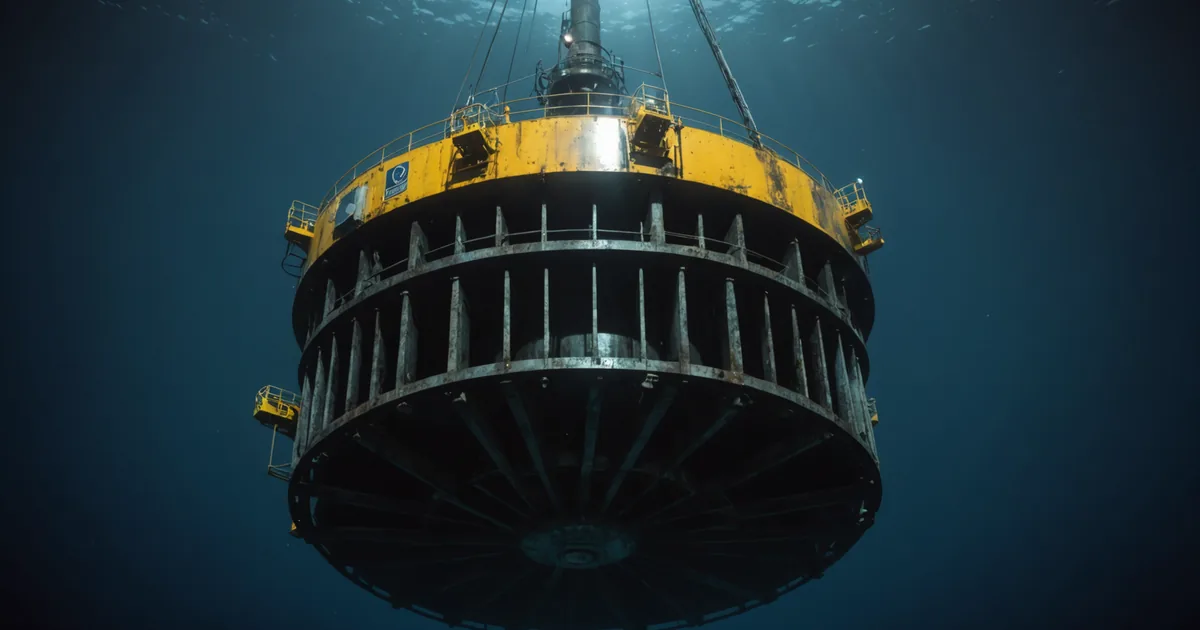
Sacrificial anode systems are the primary corrosion defence for most offshore wind monopiles and jacket structures. Zinc or aluminium alloy anodes are bolted or welded to the structure below the waterline and corrode preferentially, protecting the underlying steel. When the anodes are consumed, that protection fails and base-metal corrosion accelerates significantly in the electrolytic seawater environment.
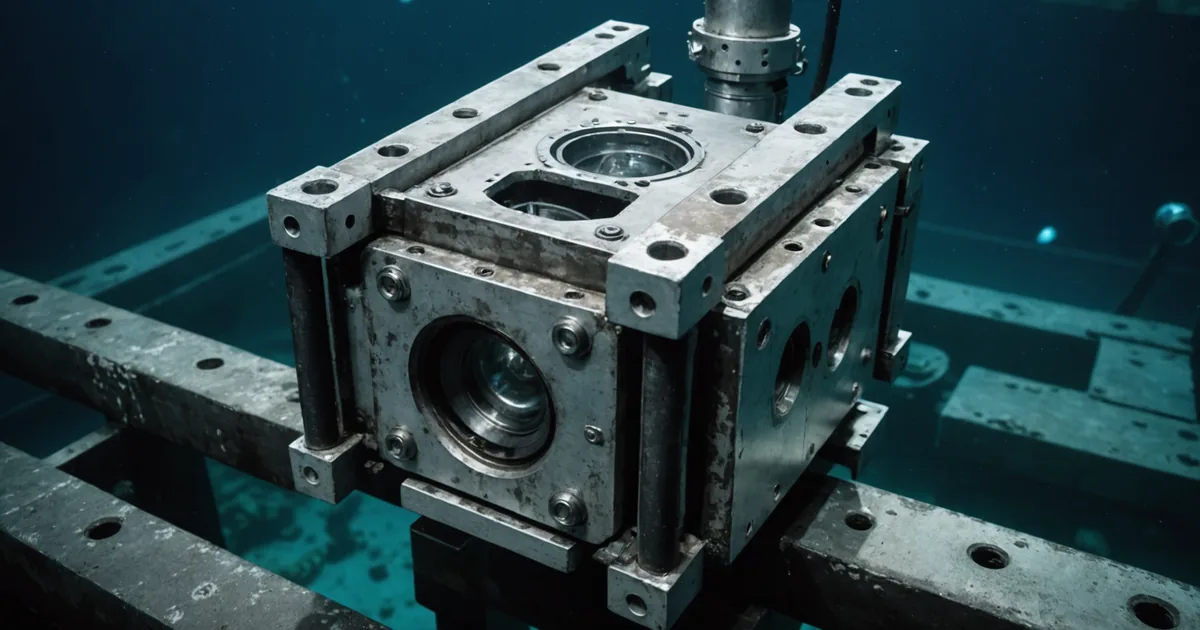
Traditional monitoring relies on direct electrochemical measurement: a reference electrode placed near the structure surface reads the steel's half-cell potential. Values in the range of -800 to -1050 mV versus Ag/AgCl indicate adequate cathodic protection. Values more positive than -800 mV signal underprotection. This kind of close interval potential survey (CIPS) requires either diver-deployed equipment or an ROV-mounted sensor with contact-radius positioning, and it takes considerable time per structure.
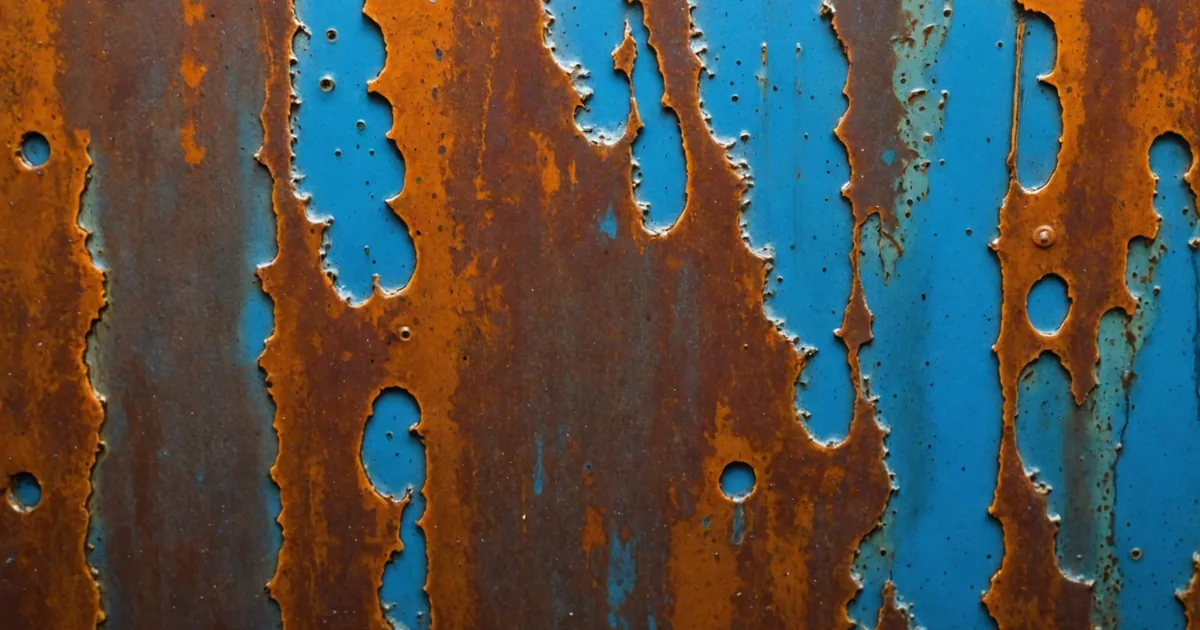
Visual inspection of anode condition is also part of most inspection programmes. A fresh zinc billet anode has predictable geometry and a distinctive surface texture. A depleted one is recognisably smaller, often with an irregular or pitted surface, and in advanced stages the steel stud or strap attachment may be partially exposed. Inspectors estimate remaining mass visually, rating anodes on a coarse depletion scale: less than 25% consumed, 25 to 50%, 50 to 75%, or effectively exhausted.
The question we started asking in early 2025 was whether this visual assessment could be automated from standard survey ROV footage, rather than requiring a dedicated CP inspection pass or specialist diver contact.
What the Beta Programme Tested
We recruited operators from our early-access cohort who had existing ROV survey datasets covering multiple structure types: monopile foundations, transition piece sections, and a limited set from jacket structure legs. We were not asking operators to conduct additional surveys. We used footage they had already captured for general condition inspection and tested whether our detection pipeline could extract useful CP-related information from it.
The specific questions were: Can we reliably identify anode locations in frames where they appear? Can we estimate a depletion category (fresh, moderate, advanced) from visual geometry and surface texture? And what are the conditions under which those estimates break down?
Across the dataset, anodes appeared in roughly 12% of frames where subsea steel surfaces were visible. Coverage was uneven: ROV survey paths are designed around corrosion and structural crack inspection, not optimised for anode viewing angles. Many anodes were partially or fully obscured by marine growth, particularly on structures older than seven years where biofouling pressure is higher.
Detection Results and Their Limitations
For anodes that were clearly visible with reasonable lighting conditions, detection accuracy was strong. In a retrospective comparison where we cross-referenced model outputs against the operator's own diver inspection records from the same survey season, classification into broad depletion bands (fresh, moderate, advanced) agreed in approximately 78% of cases. That number does not define the production floor, as it reflects a heterogeneous dataset that includes genuinely difficult footage, but it establishes a baseline for honest assessment.
The disagreements fell into three identifiable categories.
The first is lighting angle. Anode geometry is best assessed when the ROV light source is roughly perpendicular to the anode face. Oblique lighting creates shadows that make moderately depleted anodes appear more advanced than they are, or eliminates the geometric cues entirely. Our model is calibrated on footage with a range of lighting angles, but there is a distribution tail where assessment becomes unreliable and confidence scores drop accordingly.
The second is marine fouling. A heavily biofouled anode surface provides almost no usable texture signal. The model learned to flag fouled anodes as unassessable rather than misclassify them, which is the correct failure mode, but it means a meaningful fraction of visible anodes in older structures yield "insufficient data" outputs rather than depletion estimates. We view this as preferable to producing low-confidence guesses that an engineer might treat as reliable.
The third is non-standard anode geometries. NORSOK M-503 specifies anode mass requirements for North Sea structures, but anode designs vary across suppliers and installation vintages. Our training data is weighted toward bracelet and flush-mounted billet types. Long flush-mounted strip anodes, which appear on some older jacket structures, were detected at lower reliability than the dominant types in our training distribution.
What This Means for CP Inspection Programmes
We are not suggesting that ROV footage analysis replaces potential measurement surveys. Half-cell potential is the authoritative measure of protection status, and no visual method approaches its electrochemical precision. An anode can be visually intact but provide inadequate protection due to connection resistance failures or coating interactions. A CV-based depletion estimate is not a CIPS substitute and should not be treated as one.
What the beta results support is a screening and prioritisation role. If your asset fleet is large and you conduct annual ROV surveys for general condition inspection, the CP-related frames in that existing footage contain information you are currently not extracting systematically. Knowing which structures have multiple anodes in advanced depletion before you schedule dedicated CP measurement work helps prioritise the CIPS programme, particularly when vessel time and diver availability are constrained across a large array.
For operators running condition-based maintenance models, there is a secondary benefit. An anomaly record that includes anode depletion flags, timestamped and location-tagged from ROV footage, gives the integrity engineer a longitudinal view across surveys. The model itself does not answer the question of how fast a particular set of anodes is being consumed over successive surveys, but structured outputs from repeated surveys create the dataset that does allow that question to be answered.
What We Are Working on Next
The most significant gap in the current model is anode mass estimation from single-view footage. Estimating remaining mass requires knowing the original anode dimensions and the current volume, neither of which is straightforwardly available from a single 2D camera pass. We have been experimenting with multi-frame reconstruction approaches where survey footage provides sufficient angular coverage, and with classification schemes that map visible geometric ratios to mass-loss percentages using NORSOK M-503 baseline geometries. Results are useful for standard billet types but not yet production-ready for general deployment.
We are also developing a fouling-aware preprocessing step that can partially separate anode surface texture from biofouling texture before depletion classification. Early tests suggest it can recover a meaningful share of the currently unassessable observations, particularly for structures where biofouling is patchy rather than uniform.
If you ran a CP inspection programme in 2024 or 2025 and have both ROV footage and diver-measured potential data covering the same structures in the same season, cross-validated ground truth of that kind is the rate-limiting resource for improving this detection class. We are actively looking for comparison datasets from operators willing to contribute to the programme.